
The problem isn’t measurement—it’s measuring the wrong things. If you’re looking to better evaluate individual agent impact, these agent performance metrics provide a practical framework for balancing efficiency, resolution, and customer experience. Traditional call centers prioritize efficiency metrics like call volume, handle time, and agent utilization because they’re easy to track. But customers don’t judge service by how efficient your operation looks internally. They care about one simple question: “Was my problem solved easily?”
呼叫中心经理面临着一个共同的陷阱:仪表盘上堆满了各种指标,但客户满意度却不断下降。你每周都能达到平均处理时间目标,但 CSAT 分数却在下降。你的团队跟踪了 20 多项 KPI,但客户仍然抱怨重复呼叫和长时间等待。.
The problem isn’t measurement—it’s measuring the wrong things. The problem isn’t measurement—it’s measuring the wrong things. If you need a deeper framework for choosing and tracking the right metrics, this call center metrics guide explains how to align measurement with customer outcomes, not just internal efficiency. Traditional call centers prioritize efficiency metrics like call volume, handle time, and agent utilization because they’re easy to track. But customers don’t judge service by how efficient your operation looks internally. They care about one simple question: “Was my problem solved easily?”
本指南将为您拨开迷雾。您将了解到哪五项呼叫中心关键绩效指标能真正提高客户满意度,为什么体验指标优于效率指标,以及如何确定关键绩效指标的优先级,而不至于让您的团队被数据淹没。.
重要启示 呼叫中心关键绩效指标
- 您将学到什么?为什么 KPI 越少效果越好? 与监控 20 多个运营统计数据的团队相比,跟踪 5-7 个核心客户体验指标的呼叫中心提高满意度的速度始终更快。原因很简单--专注才能行动。当优先级明确时,座席人员就能在通话过程中做出更好的决策,而不是纠结哪个指标最重要。.揭示客户感知的指标: Customer Satisfaction Score (CSAT), CSAT measures how satisfied customers feel right after an interaction. It’s usually collected through a short post-call or post-chat survey. To systematically improve these scores at scale, many teams rely on structured CSAT improvement strategies supported by tools and automation.
- Net Promoter Score (NPS), and First Call Resolution (FCR) measure outcomes customers actually feel. Efficiency metrics like Average Handle Time (AHT) support these goals but should never override them—speed without resolution destroys trust.不断下降的关键绩效指标如何在运营中体现出来: 糟糕的客户体验指标不会隐藏在仪表板中。它们会以重复呼叫(FCR 低)、升级增加(客户努力程度高)、负面评论(CSAT 低)以及最终流失(NPS 下降)的形式出现。每个症状都指向客户旅程中的特定摩擦。.建立推动决策的仪表盘: 最好的 KPI 面板可以帮助经理和代理做出实时决策,而不仅仅是生成报告。如果指标清晰且可操作,团队就能及早发现问题,并在问题成为系统性问题之前加以解决。.
注重客户体验的呼叫中心关键绩效指标为何重要

呼叫中心过去主要作为成本中心来衡量。速度、数量和处理时间在仪表盘上占据主导地位。如今,这种思维模式破坏了客户体验。.
客户不会根据你的内部运作效率来判断一个电话的好坏。他们只看一个问题“我的问题是否很容易就得到了解决?以客户体验为中心的关键绩效指标可以直接回答这个问题。.
跟踪太多指标会产生噪音。团队追逐目标,却不了解影响。一个常见的例子是平均处理时间被压得太低。座席人员匆忙接听电话,客户感到被忽视,问题再次出现。在纸面上,业绩看起来很好。但实际上,忠诚度却在下降。.
客户体验关键绩效指标是对现实的检验。它们将呼叫结果与客户感知、努力和信任联系起来。当这些关键绩效指标向错误的方向发展时,就预示着真正的业务风险:重复接触、负面口碑和客户流失。.
现实世界的例子
一个拥有 200 名代理的联络中心设定了一个积极的平均处理时间目标:将每个呼叫的处理时间从 8 分钟缩短至 5 分钟。在三个月内,该团队连续实现了目标。管理层对效率的提高表示祝贺。.
但从其他指标来看,代价也是显而易见的:
- 首次呼叫解决率从 78% 降至 61%-代理匆忙打电话,没有完全解决问题
- 重复呼叫量增加 34%-客户就同一问题多次回电
- CSAT 分数从 4.2 分降至 3.6 分(满分 5 分-客户感到被忽视,听不到他们的声音
- 整体解决时间增加-计算所有回拨电话,尽管单个电话通话时间较短,但客户花费了更多时间获得帮助
从纸面上看,这种运营方式效率很高(呼叫速度更快,处理的呼叫量更大)。但实际上,由于重复处理,成本上升,座席人员的士气因重复来电而受挫,客户忠诚度下降。.
这就是客户体验关键绩效指标的重要性所在。. 它们起到现实检验的作用。当效率指标提高而体验指标下降时,这是一个警告信号,而不是成功。客户体验关键绩效指标能让团队专注于客户真正注意到的结果:解决、努力和满意度。.
这就是客户体验关键绩效指标的重要性所在。它们让团队关注客户感受到的结果,而不仅仅是管理者看到的数字。.
怎样的 KPI 才是客户体验 KPI
定义客户体验关键绩效指标
客户体验关键绩效指标衡量的是客户对互动的看法和感受。它从客户的角度出发,重点关注满意度、努力程度和解决方案。.
与运营指标不同,客户体验关键绩效指标通常是滞后指标。它们反映的是互动过程中已经发生的事情。这使它们非常强大。它们概括了服务质量的实际影响。.
客户体验关键绩效指标可以回答以下问题
- 问题解决了吗?
- 这个过程容易吗?
- 客户会再次信任我们吗?
如果一个指标与这些问题没有明确的联系,它就不是客户体验关键绩效指标。.
糟糕的客户体验关键绩效指标在现实生活中的表现
当 CX KPI 下降时,症状会迅速显现。.
- 重复来电增加, 这通常与首次呼叫解决率低有关。.
- 客户投诉增加, 这表明 CSAT 较低或努力程度较高。.
- 升级增长, 这表明代理商无法自信地解决问题。.
- 流失率增加, 通常情况下,NPS 趋势不佳。.
每个症状都表明客户旅程中存在摩擦。客户体验关键绩效指标可帮助您及早发现并解决这些问题,避免其演变成系统性问题。.
客户体验关键绩效指标与效率指标的比较
| 地区 | 客户体验关键绩效指标 | 效率指标 |
|---|---|---|
| 主要重点 | 客户感知 | 内部生产力 |
| 典型业主 | 客户体验或支持领导 | 业务管理 |
| 客户影响 | 直接可见 | 间接 |
| 滥用的风险 | 误读情绪 | 有害经验 |
客户体验方面最重要的 5 个呼叫中心关键绩效指标
客户满意度得分 (CSAT)
CSAT 衡量客户在互动后的满意度。通常通过简短的通话后或聊天后调查来收集。.
CSAT 反映了即时情绪。这使其成为体验质量的最快信号之一。一个糟糕的流程变更往往会首先在这里显示出来。.
问题示例
“您对今天获得的支持满意吗?”
CSAT 在调查简短并立即发送的情况下效果最佳。延迟调查会降低准确性。低回复率也会使结果偏向极端意见。.
常见陷阱:
- 问题太多。.
- 在通话后很长时间才发送调查问卷。.
- 仅使用 CSAT,而不结合其他关键绩效指标。.
如果使用得当,CSAT 可以告诉您客户在体验新鲜感时的感受。.
净促进者得分 (NPS)
NPS 通过询问客户推荐贵公司的可能性来衡量忠诚度。它将客户的回答分为推荐者、被动者和反对者。.
呼叫中心的互动在很大程度上影响着 NPS,对于以支持为导向的企业来说尤其如此。一个未解决的问题就能让中立客户变成反感者。.
NPS 最适合发现长期趋势。它对评估单个呼叫的作用较小。使用它可以了解您的整体支持体验是否随着时间的推移而建立信任。.
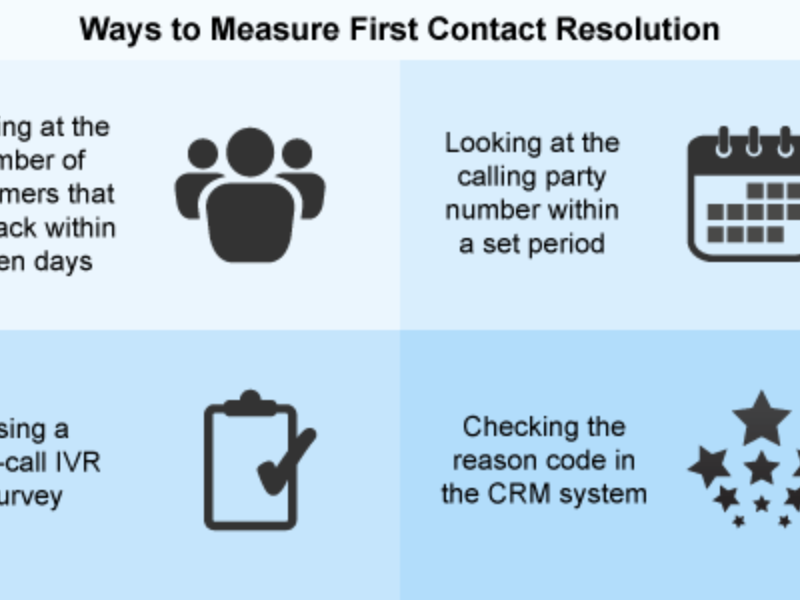
首次呼叫解决(FCR)
FCR 跟踪客户的问题是否在第一次互动中得到完全解决。它是预测满意度和忠诚度的最有力指标之一。.
FCR tracks whether a customer’s issue is fully resolved in the first interaction. It’s one of the strongest predictors of satisfaction and loyalty. To improve and scale resolution rates effectively, many teams adopt specialized tools like first call resolution software that provide real-time insights, repeat-call detection, and agent guidance during live interactions.
高 FCR 可减少工作量。客户不想重复。他们想要结束。.
实际运作方式
在第一次通话中解决了账单问题,就能提高 CSAT,减少重复联系。同样的问题升级两次会增加工作量和挫败感。.
如何提高首次呼叫解决率:
1.实施基于技能的路由选择
根据问题的复杂程度和座席人员的专业技能,而不仅仅是下一位座席人员的情况,对电话进行分流。账单纠纷应由受过支付系统培训的座席人员处理。技术故障排除应由产品专家负责。路由不当会迫使座席人员在通话中途转接电话,重新设置客户情境并损害 FCR。.
举例说明:某联络中心将所有呼叫路由到普通队列,结果发现 40% 的技术呼叫至少被转接了一次。实施基于技能的路由后,技术呼叫转移下降到 8%,FCR 从 68% 提高到 79%。.
2.让代理即时访问客户历史记录
在客户等待的过程中,座席人员每次拨打电话都要浪费 30-45 秒钟来查找账户信息。更糟糕的是,他们往往无法看到以前的互动,从而迫使客户重新解释问题。.
解决方案:将呼叫中心平台与客户关系管理(CRM)集成,这样当呼叫接通时,就会自动显示账户详情、以前的票据和互动历史。这就消除了 “让我调出您的账户 ”的延迟,这种延迟会让客户感到沮丧,并耗费座席人员的时间。.
3.创建明确的升级路径
当代理无法独立解决问题时,他们需要快速联系主管或专家。不明确的升级流程会导致
- 长时间搁置,工作人员在寻找帮助
- 重置上下文的多次传输
- 客户向 3 个以上的人重新解释问题
最佳做法:启用 “温馨转接”,即第一位座席人员在移交呼叫之前向专家介绍情况。这样可以保持连续性,避免客户重复自己的故事。.
4.建立全面的知识库
代理需要快速回答非日常问题。当他们无法快速找到信息时,他们要么猜测(冒着错误解决的风险),要么进行不必要的转接(损害 FCR)。.
有效的知识库包括
- 可通过关键字搜索,而不是埋藏在文件夹结构中
- 根据新问题定期更新
- 以通俗易懂的语言编写,代理商可快速扫描
- 可从与呼叫界面相同的屏幕访问
现实的 FCR 基准:
- 行业平均水平:70-75%
- 业绩最佳的联络中心:80-85%
- 世界一流的操作:85%+
如果您的 FCR 低于 65%,请审核您的路由、培训和知识访问系统。问题很少是 “座席人员不够努力”--通常是系统或流程问题阻碍了他们解决问题。.
客户努力得分 (CES)
CES 衡量客户获得帮助的难易程度。它关注的是努力程度,而不是速度。.
互动可能很快,但仍然令人沮丧。多次转接、解释不清或步骤复杂,即使解决速度很快,也会增加工作量。.
客户始终喜欢简单、可预测的体验。与单纯的速度相比,较少的努力更能可靠地建立信任。.
呼叫放弃率
呼叫放弃率显示有多少客户在接通座席之前就挂断了电话。高放弃率会损害信任度,也会让人觉得服务态度不佳。.
放弃往往是一种症状。排队时间过长、人员配备不足或 IVR 路径不清晰通常是造成这种情况的原因。.
只有从根本上解决问题,而不是孤立地优化指标,减少放弃率才能改善体验。.
支持间接影响客户体验的呼叫中心关键绩效指标
支持客户体验的衡量标准
五项核心关键绩效指标(CSAT、NPS、FCR、CES、放弃率)直接衡量客户感知、, 业务指标作为先行指标. .它们可以帮助您在 CX 问题出现在满意度评分中之前加以预防。.
平均应答速度 (ASA) 塑造第一印象
客户在与座席人员交谈之前就会对您的服务质量形成看法。两分钟的等待让人感觉是放弃。而 15 秒的等待则会让人觉得您有求必应。.
ASA 基准:
- 行业标准:20-30 秒
- 良好性能:15-20 秒
- 性能卓越:<15 秒
- 问题阈值:>45秒(放弃风险急剧增加)
当人工服务质量下降时,客户往往会对互动感到沮丧,即使是完美的代理表现也会感到不足。他们记住的是等待,而不仅仅是解决问题。.
各渠道的首次响应时间 (FRT) 必须保持一致
在全渠道环境中,客户期待一致性。如果电话支持只需 20 秒就能回复,而电子邮件却需要 8 小时,那么即使两种渠道最终都能解决问题,客户也会产生挫败感。.
问题在于:客户并不认为渠道是独立的。他们看到的是一家公司以不同的速度作出反应。不一致的 FRT 会让人产生被忽视的感觉:“他们立即接听电话,却不理我的电子邮件”。”
最佳做法:为每个渠道设定目标故障穿越时间,并监测遵守情况:
- 电话<30 秒
- 即时聊天:<2 分钟
- 电子邮件:工作时间内 <4 小时
- 社交媒体:<1小时
这些目标应符合客户群的期望。与 B2C 消费者服务相比,B2B 企业支持通常能维持更长的首次报告时间。.
平均处理时间(AHT)需要仔细权衡
如果跟踪正确,AHT 是有用的;如果优化不当,AHT 是危险的。.
Average Handle Time (AHT) requires careful balance.
AHT is useful when tracked correctly—and dangerous when optimized incorrectly. Many teams focus heavily on speed, but without proper context, this can hurt resolution and overall experience. Strategies for effective average handle time reduction should prioritize smarter workflows, better agent support, and issue complexity alignment rather than forcing shorter calls at all costs.
正确的方法 按问题类型跟踪 AHT。不同的问题需要不同的处理时间:
- 密码重置:2-3 分钟
- 账单查询:5-7 分钟
- 技术故障排除:8-12 分钟
- 解决争议:10-15 分钟
按照同一目标优化所有互动会产生问题。座席人员匆忙处理复杂问题,损害了 FCR。相反,座席人员在简单请求上花费过多时间,造成不必要的队列堆积。.
错误的方法 设定单一的 AHT 目标(如 “所有通话时间低于 6 分钟”),并根据该目标跟踪座席。这样做的目的是鼓励加快解决问题的速度。.
您的 AHT 目标正在损害 CX 的警告信号:
- 固定资产报酬率下降,而平均日工作效率提高
- 代理经常在目标时间内中断通话
- 客户回电提出未解决的问题
- 尽管实现了 AHT 目标,但 CSAT 仍在下降
原则: 运营指标应支持客户体验关键绩效指标,而不是与之竞争。如果效率指标提高了,而体验指标却下降了,那么效率的优化就是错误的。.
如何确定呼叫中心关键绩效指标的优先次序而无需跟踪所有指标
更多的关键绩效指标并不能带来更好的决策。明确的优先事项才会。.
从五个核心的客户体验 KPI 开始:CSAT、NPS、FCR、CES 和放弃率。这些指标涵盖满意度、忠诚度、解决率、努力程度和访问率。.
随着团队规模的扩大,辅助指标有助于诊断问题,而不是取代客户满意度目标。每季度审查一次关键绩效指标。删除无法推动行动的指标。.
一个简单的规则非常有效:如果 KPI 不能改变行为,它就不属于仪表盘。.
使用呼叫中心关键绩效指标时的常见错误
- 错误 1:优化 AHT,牺牲分辨率一家中型联络中心通过实施严格的时间目标,将平均处理时间从 6 分钟缩短至 4 分钟。主管们表扬了最快完成呼叫的座席人员。效率的提高在周报中看起来令人印象深刻:
- 首次呼叫解决率从 78% 降至 61%-代理匆忙接完电话,没有完全解决问题
- 重复呼叫量增加 34%-客户不得不为同一问题多次致电
- 客户满意度从 4.2 降至 3.6-客户感到被忽视,听不到他们的声音
悖论:个人通话时间变短了,但 总分辨率时间增加 在计算所有回拨时。客户花费了更多的时间获得帮助。尽管 “提高了效率”,但成本还是上升了。”
教训应监控 AHT,而不是将其降到最低。根据问题的复杂程度进行跟踪。简单的请求应快速处理。复杂问题则需要适当的时间。.
错误 2:使用 NPS 对代理进行个人评估
净推荐值衡量的是对公司的忠诚度,而不是座席人员的个人表现。然而,许多呼叫中心将 NPS 作为绩效指标,甚至将其与座席人员的薪酬挂钩。.
这就产生了两个问题:
问题 1 - 选择偏差:
座席人员避免处理疑难案件,因为他们知道,无论处理质量如何,复杂的问题都会降低 NPS 分数。他们成了 “高风险 ”电话的转接专家。由于座席人员优先考虑保护自己的分数,而不是解决问题,因此 FCR 受到了影响。.问题 2 - 调查辅导:
当代理商知道他们的评价标准是 NPS 时,他们就会开始指导客户:“如果您对我们今天的帮助感到满意,请在调查中给我们打 9 分或 10 分--任何低于 9 分或 10 分的分数都会影响我的评价”。这使得数据变得毫无意义。.解决之道:将 NPS 用于有关产品、政策和整体服务质量的战略决策。将 CSAT 用于代理人层面的辅导和评估--它能更准确地反映个人互动质量。.
错误 3:跟踪过多指标,却没有明确的优先事项
一家业务流程外包公司在其管理仪表板上跟踪 28 种不同的关键绩效指标。每周,领导团队都要在报告会议上花费 4 个多小时来审查图表、图形和趋势线。.
尽管进行了这么多测量,他们还是无法回答简单的问题:
- 哪些指标能真正预测客户满意度?
- 我们应该优先考虑降低 AHT 还是提高 FCR?
- 当衡量标准发生冲突时,哪个优先?
分析瘫痪开始了。团队争论仪表板的设计,而不是改进服务。代理收到的信号好坏参半--因 AHT 而受到表扬,却因 FCR 低而受到批评,无法明确哪个更重要。.
解决方案 从 5-7 个核心关键绩效指标开始。只有在辅助指标能回答具体问题或诊断已知问题时,才添加辅助指标。遵循这一规则: 如果某项指标不能改变你的决策或行动,就将其从仪表板中删除。.
错误 4:忽视数字背后的 “原因
量化的关键绩效指标显示 情况. .客户意见和通话录音说明 为什么.
某联络中心的 CSAT 在六周内从 4.2 降至 3.8。团队审查了所有常见问题:AHT 保持稳定,FCR 没有明显变化,放弃率很低。.
最后,他们查看了客户的评论记录,发现了一个规律。客户反复写道:
- “我已经向上任特工解释过了”
- “为什么我每次都要重新开始?”
- “似乎没人知道我之前打过的电话”
问题不在于座席人员的技能或态度,而在于系统故障。在通话过程中,座席人员无法看到以前的交互历史,这迫使客户每次回电时都要重新解释问题。.
教训 将定量 KPI 与定性审查相结合。阅读客户评论。聆听通话录音。数字揭示症状,背景揭示原因。.
利用技术跟踪客户体验关键绩效指标(高层次)
现代工具有助于集中洞察客户体验。.
- 交互分析揭示了反复出现的痛点。.
- 智能路由可减少工作量和转接次数。.
- 实时警报可及早发现 CX 风险。.
技术支持决策,但关键绩效指标决定方向。.
如何利用呼叫中心关键绩效指标改善客户体验
- 步骤 1:审核当前的 KPI 面板首先列出您目前跟踪的每项指标。要全面--包括代理商仪表板、管理报告和执行演示中的指标:
- 这是否直接衡量了客户的看法? (满意度、忠诚度、努力程度)
- 这是否支持衡量客户感知的指标? (例如,ASA 支持放弃率)
- 在过去的 90 天里,这一指标是否改变了我们的行为?
如果三个问题的答案都是 “否”,则应将其删除。.
大多数团队发现,他们可以取消 40-60% 个跟踪指标,而不会失去有意义的可见性。这些被淘汰的指标造成的是噪音,而不是洞察力。.
第 2 步:定义核心的五项客户体验关键绩效指标,并制定明确的目标
选择这五个作为你的基础:
- 客户满意度得分 (CSAT)
目标:4.2+(满分 5 分)(或 85%+ 满意率 - 净促进者得分 (NPS)
目标:依行业而定(B2B 通常为 30-50,B2C 消费者为 50-70)。 - 首次呼叫解决(FCR)
目标:75%+(竞争性行业为 80%+)。 - 客户努力得分 (CES)
目标:<3 分,7 分制(越低越好) - 呼叫放弃率
目标:<5%(在竞争激烈的市场中,目标为<3%)
重要: 根据行业背景调整这些目标。收账业务在 CSAT 和 NPS 上的得分自然会低于客户入职团队。以类似业务为基准,而不是无关的垂直行业。.
步骤 3:实施自动化测量基础设施
手动 KPI 跟踪无法扩展。您需要能自动获取数据的系统,而无需代理输入或经理编译。.
基本自动化:
- 互动后调查: 呼叫完成后立即触发短信或电子邮件(60 秒内)
- 通话录音: 自动记录所有互动,并提供可搜索的记录誊本
- 实时仪表盘 代理和经理均可看到实时 KPI 显示
- 计划报告: 每周自动汇总,突出趋势和异常值
没有自动化,KPI 的改进就变成了猜测。代理无法自我纠正,因为他们看不到自己的表现。管理人员无法识别模式,因为数据传输太慢。.
步骤 4:按不同的时间尺度审查关键绩效指标
不同的节奏有不同的作用:
实时监测(连续):
注意即时问题:队列堆积、异常放弃高峰、系统中断。实时警报有助于监管人员在小问题演变成危机之前进行干预。.每周回顾(每周一):
检查过去 7 天的趋势线。最近的变化(新脚本、路由调整、培训课程)是否改善或损害了 KPI?每周审查显示行动是否有效。.每月分析(每月第一周):
研究 30-90 天内的模式。识别季节性趋势、系统性改进或逐步退化。月度审查可以发现每周数据所掩盖的缓慢发展的问题。.季度深度调查(季度末):
将关键绩效指标与业务成果联系起来的综合分析:收入、保留率和每次联系的成本。季度审查可为有关人员配备、技术投资和服务模式变革的战略决策提供依据。.避免每日痴迷: 个人日常得分波动主要是噪音。一个特工今天表现不好并不代表趋势。三个糟糕的星期才是问题。.
步骤 5:将关键绩效指标与行动联系起来,而不仅仅是观察
只有数据而没有行动的仪表盘会浪费每个人的时间。对于每一个关键绩效指标,都要明确当其超出可接受范围时将采取的行动。.
行动触发器示例:
KPI 触发器 行动 CSAT 下降到 4.0 以下 查看最近 20 次通话记录 识别常见故障模式;更新培训或脚本 FCR 下降到 70% 以下 分析转移原因 检查路由是否将复杂问题发送给训练不足的代理 8% 以上的放弃率激增 按时间检查队列深度 调整轮班表或实施回调选项 NPS 下降 10+ 点 直接调查诋毁者 进行后续访谈以了解根本原因 如果没有明确的行动,关键绩效指标就会成为记分牌,而不是管理工具。.
步骤 6:将衡量标准与辅导而非惩罚挂钩
关键绩效指标应推动改进,而不是恐惧。如果惩罚性地使用指标,代理商就会玩弄系统:
- 为达到 AHT 目标而匆忙拨打电话(损害 FCR)
- 转接疑难电话,保护 CSAT 分数
- 指导客户如何回答调查问卷
更好的方法:诊断性地使用 KPI。当某个代理的 FCR 很低时,听听他们的通话。他们是否在某些主题上训练不足?他们是否缺乏获取信息的途径?他们是否接到了超出其技能范围的问题?
首先解决系统问题。其次是指导个人表现。.
步骤 7:简化,然后保持纪律
五项核心 CX KPI。每周回顾。每月深入分析。定义行动触发器。.
这样的结构足以推动持续改进,而不会造成官僚主义。.
抵制添加更多指标的诱惑,只是因为你 会 衡量它们。每一个新的关键绩效指标都会削弱重点。复杂并不等于先进。.
规则 如果你不能用一句话解释为什么某个指标很重要,也不能确定如果指标发生变化你会采取什么行动,那就不要跟踪它。.
常见问题 - 呼叫中心客户体验关键绩效指标
哪个 KPI 对客户体验最重要?
首次呼叫解决率通常是最有力的预测指标,尤其是与 CSAT 结合使用时。.
呼叫中心应该跟踪多少个客户体验关键绩效指标?
对于大多数团队来说,五个核心关键绩效指标就足够了。.
效率指标是否不利于客户体验?
它们在平衡时支持 CX,但在单独优化时会损害 CX。.
小型团队能否有效使用这些关键绩效指标?
是的,简单的设置往往能更快地洞察一切。.
结论

客户体验不会因为仪表盘变得越来越复杂而得到改善。当团队跟踪的指标越来越少,而这些指标又非常重要时,客户体验就会得到改善。.
本指南涵盖的五个核心 KPI--CSAT、NPS、FCR、CES 和放弃率--衡量的是客户的感受,而不仅仅是您的内部运营表现。持续跟踪这些指标,您就能在客户流失之前发现摩擦。如果忽视这些指标,只追求纯粹的效率指标,就会在优化过程中导致客户不满。.
您的下一步
- 本周: 审核您当前的 KPI 面板。列出您跟踪的每项指标。剔除任何不能直接衡量或支持客户体验的指标。.
- 这个月 为五项核心客户体验关键绩效指标确定明确的目标。确保每位代理和经理都知道 “好 ”是什么样子,以及为什么这些数字比运营效率指标更重要。.
- 本季度 建立自动化基础设施,无需人工即可跟踪这些关键绩效指标。测量不一致,改进就无从谈起。.
原理很简单: 对五项关键绩效指标进行严格跟踪,并设定明确的行动触发点,对客户体验的改善效果要好于对二十项指标进行偶尔审查而不采取后续行动。.
您的客户并不关心您监控了多少指标。他们关心的是他们的问题是否能轻松得到解决。将衡量重点放在他们感受到的结果上,其他一切都会变得简单。.
更多信息
- 什么是业务流程外包呼叫中心?定义、类型和益处
- 什么是交互式语音应答(IVR)?完全指南
- 应收账款外包:益处与风险