

服务水平衡量呼叫中心接听来电的速度,以及客户等待时间是否超过可接受的阈值。本指南解释了标准服务水平计算公式、常见的测量误差以及运营团队如何使用服务水平数据来优化人员配置决策。您将学会如何准确计算服务水平,并解释结果以改进实际运营。.
什么是呼叫中心服务水平?

服务水平是一种基于百分比的指标,用于衡量有多少呼入电话在预定义的时间阈值内得到接听。平均等待时间可能会掩盖性能问题,而服务水平则不同,它提供了二进制的通过/失败衡量标准:这通电话是达到了你的速度标准,还是超出了你可接受的等待时间?
例如,如果您的目标是在 20 秒内接听 80% 的电话,那么服务水平就会跟踪您是否在一天中的每个时间段都始终达到了这一阈值。.
主要特点
-
基于百分比的测量: 服务水平报告的是符合标准(如 82%)的呼叫比例,而不是平均等待时间。这样可以防止异常值扭曲您对客户体验的理解。.
时间阈值依赖性: 您的服务水平只有在您设定的阈值范围内才有意义。在 60 秒内接听 80% 个电话与在 15 秒内接听 80% 个电话所代表的客户体验截然不同。.
队列性能指标: 服务水平衡量的是呼叫者从队列转到座席的速度,而不是通话过程中发生的情况。高服务水平意味着接听速度快,但并不能保证第一时间解决呼叫或高质量的互动。.
“在规定时间内接听 ”是指在时间到达该界限之前,由一名座席人员接听电话。.
例如
- 如果您的目标是在 20 秒内接听 80% 的电话,那么服务水平将跟踪您是否实现了这一目标。.
服务水平常常与平均指标相混淆。这是一个错误。.
平均值隐藏了峰值和延迟。服务水平则暴露了它们。.
引用的权威来源: ICMI:80/20服务水平的历史, Calabrio:服务水平术语表, 和 Genesys:什么是服务水平?.
呼叫中心运营中的服务水平为何至关重要

服务水平既是客户体验指标,也是运营诊断工具。.
客户影响:
较高的服务水平与较低的放弃率直接相关。当服务水平从 85% 降至 70% 时,由于客户对漫长的等待时间失去耐心,放弃率通常会增加 10-15 个百分点。每一次放弃呼叫都意味着一次机会的丧失--无论是销售咨询、支持请求还是挽留谈话。.
人员配置的准确性:
服务水平揭示了您的人力规划是否与实际需求相符。在下午时段持续达不到目标,说明高峰期人员配备不足。相反,如果远远超出目标,则可能表明人员配置过多--支付了本可部署到其他地方的闲置代理费用。.
实时管理:
与日终平均值不同,服务水平可在整个工作时间内持续监控。当班中出现性能下降时,主管人员可以立即做出反应,从优先级较低的队列中重新分配座席,或在放弃率飙升之前激活回呼协议。.
运行稳定性:
跨日跨周的稳定服务水平表现表明运营是可预测的。不稳定的服务水平模式--周一达到目标,但周四未能达到--表明预测有问题、出勤率不一致或调度缓冲不足。.
标准呼叫中心服务水平公式

最广为接受的公式是简单而一致的。.
服务水平(%)=(在时限内接听的电话数量 ÷ 总呼入电话数量)× 100
以下是每个部分的含义:
- 在临界值内接听的电话:
话务员在时限到期前接听的电话。. - 服务级别阈值:
允许的最长等待时间(例如 20 秒)。. - 提供的电话:
所有到达队列并可以接听的呼入电话,包括放弃的电话。.
为什么 “提供的电话 ”很重要?
- 它反映了真实的需求。.
- 它可以防止结果膨胀。.
- 它使报告与客户实际情况保持一致。.
不同系统对指标的标注可能不同,但逻辑应该保持一致。.
如何逐步计算呼叫中心服务水平
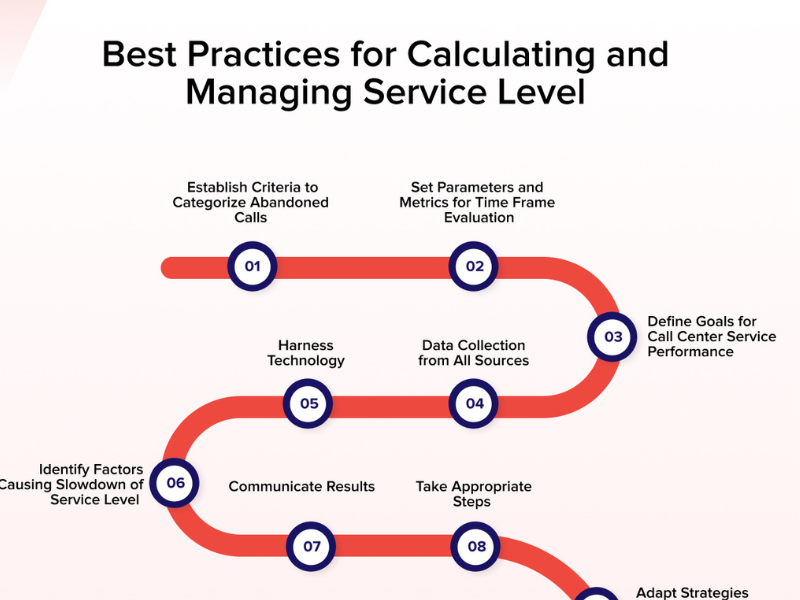
每次都遵循这些步骤,以保持一致性。.
- 确定您的门槛
决定对客户最重要的等待时间,如 20 秒或 30 秒。. - 计算提供的呼叫总数
包括在此期间进入队列的所有呼入电话。. - 计算在临界值内接听的电话
只包括在时限前接听的电话。. - 应用公式
用阈值内已接听来电除以提供的来电。乘以 100。.
一致性比完美更重要。.
每个报告期使用相同的规则。.
简单计算示例
假设间隔时间为 30 分钟:
| 公制 | 价值 |
|---|---|
| 提供的电话 | 200 |
| 20 秒内接听来电 | 160 |
计算:
服务水平 = (160 ÷ 200) × 100 = 80%
口译:
- 你达到了 80/20 的目标。.
- 20% 的呼叫者等待时间超过预期或放弃呼叫。.
这个数字比平均等待时间更能说明问题。.
了解服务级别阈值(80/20 解读)

每个服务级别目标都由两个部分组成:百分比和时间阈值。80/20 “表示 80% 的电话在 20 秒内接通。.
为什么 80/20 成为行业标准?
80/20 基准源于数十年来对客户耐心与运营成本之间平衡的研究。研究表明,大多数客户都能忍受 15-20 秒的等待时间,而不会对满意度产生重大影响,而在 10 秒内接听每一个呼叫所需的座席数量将比大多数运营成本高出 30-40%。80% 是一个可以实现的目标,并不要求完美的性能--允许呼叫量和座席可用性的正常变化。.
常见变体
- 90/30: 对紧急程度较低的队列(账单查询、一般问题)采用更宽松的标准
- 85/15: 对高价值客户群(高级支持、VIP 线路)实行更严格的标准
- 70/20: 可用于溢出期或预计流量高峰期
正确的阈值取决于客户期望、呼叫紧迫性和运营限制,而不是任意的行业惯例。.
80/20 的作用 不 是指
- 每个呼叫等待 20 秒。.
- 其他 20% 并不重要。.
80/20 为何受欢迎
- 它兼顾了客户耐心和人员成本。.
- 这对大多数入站团队来说都是可以实现的。.
- 它对一般的辅助线也很有效。.
重要的权衡:
- 更短的阈值可以改善体验,但需要更多的代理。.
- 较长的阈值会降低成本,但会增加放弃率。.
80/20 是准则,而不是规则。.
根据客户的期望和呼叫的紧迫性选择目标。.
服务水平 按行业划分的基准指标
不同行业具有不同的紧急程度特征,因此合适的服务水平目标取决于您的来电者期望。这些基准数据来源于 国际客户管理协会(ICMI) 和 Calabrio 联络中心调研:
| 行业 | 典型目标客户 | 推理 |
|---|---|---|
| 银行与金融 | 20秒内完成率90%(90/20) | 欺诈及账户访问类电话需及时处理;等待时间过长 = 信任流失 |
| 医疗保健 | 30 秒内完成率 85%(85/30) | 紧急(临床)与行政类电话混杂;需兼顾速度与准确性 |
| 零售/电子商务 | 30秒内完成80%(80/30) | 订单状态和退货政策具有时间灵活性;客户能够接受适度的等待。 |
| 公用事业与电信 | 60 秒内完成 80%(80/60) | 高呼入量,非故障事件期间单次通话的紧急程度较低 |
| 技术支持 / 软件即服务(SaaS) | 60 秒内完成 75%(75/60) | 复杂问题;用于排查的时间常常超过等待时间 |
| 外呼销售 | 不适用(不同的关键绩效指标) | 销售中心衡量的是接通率和转化率,而非服务水平。 |
标准的“80/20”规则源自20世纪80年代的贝尔实验室,当未设定具体基准时,该规则仍是行业默认标准——但它仅是一个起点,而非普适真理。
放弃呼叫如何影响服务水平计算

当客户在座席人员接听之前挂断电话时,即为放弃呼叫。从服务水平计算的角度来看,放弃呼叫至关重要,因为它们代表着服务的彻底失败--客户需要帮助却放弃了等待。.
为什么必须将放弃的呼叫包括在内?
从 “提供的呼叫 ”分母中剔除放弃的呼叫会人为夸大服务水平结果。例如,如果有 200 个呼叫进入您的队列,其中 150 个在 20 秒内接听,30 个放弃,您的服务水平就是 75%(150/200)。如果剔除 30 个放弃的呼叫,您的服务水平似乎为 88%(150/170)--这种误导性的表述掩盖了重大的客户体验问题。.
放弃呼叫与服务水平直接相关。当平均等待时间增加时,放弃率通常也会成正比上升。如果一个队列在服务水平为 85% 时有 5% 的放弃呼叫,那么当服务水平下降到 70% 时就会有 15% 的放弃呼叫。这些客户没有得到帮助--他们既代表了即时服务失败,也代表了潜在的长期关系损害。.
短暂放弃例外:
大多数呼叫中心将 5 秒以内的放弃呼叫排除在外,将其视为误拨或意外挂断,而不是服务故障。在 3 秒内挂断电话的客户可能从未打算完成呼叫。但是,超过 5 秒的放弃呼叫表明客户有意选择等待,然后放弃--必须将其计算在内,以准确反映您的服务绩效。.
忽视废弃电话通常会使服务水平看起来比实际情况更好。.
服务水平和放弃率是一个问题的两个方面:
- 等待时间越长,放弃率越高。.
- 较高的放弃率表明服务水平较差。.
是否包括或不包括放弃的呼叫?
实际上,大多数中心
- 包括放弃的呼叫 在 “提供的电话 ”中。”
- 不包括很短时间的放弃 (通常少于 5 秒)。.
短时间放弃通常是误拨或即时挂断。.
需要关注的主要风险:
- 在报告中途改变放弃规则会扭曲趋势。.
- 排除过多的遗弃物会掩盖真正的问题。.
- 比较不同规则的报告会得出错误的结论。.
最佳做法:
- 选择一条明确的规则。.
- 记录下来。.
- 持续应用。.
5种常见的服务水平公式变体(TSF)
服务水平(也称为电话服务因子,TSF)有5种标准计算公式变体,具体取决于您如何处理被放弃的呼叫。请选择其中一种并始终如一地使用——在不同报告中混用这些公式会导致“苹果与橙子”的不当对比。
| 计算公式 | 治疗 | 何时使用 |
|---|---|---|
| 一级方程式赛车(简易版) | 已接听电话数 ÷ 总呼入电话数 | 默认:将放弃行为视为失败(最贴近客户体验) |
| 公式 2(正向放弃) | 应答率 = 阈值 ÷(呼入总量 − 超过阈值后放弃的呼叫数) | 当放弃者在达到阈值后仍选择放弃时,向中心记入积分 |
| 公式 3(排除所有放弃通话) | 应答率 = 接通量 ÷(呼入总量 − 全部放弃量) | 最宽松;通常会虚高评分,掩盖问题 |
| 公式 4(排除短时放弃) | 已接通量 = 阈值 ÷ (呼入总量 − 5秒内放弃通话量) | 移除误拨电话;均衡选择 |
| 公式 5(加权) | 接通率 = 阈值 ÷(呼入总量 − 阈值前放弃量) | 被某些 Erlang-C 人员配置模型所采用 |
大多数现代呼叫中心平台默认采用 一级方程式赛车 或 公式 4. 如果您正从传统ACD系统迁移,请向新供应商咨询他们采用的是哪种计算公式——仅因公式选择不同,报告数据就可能产生5%至15%的波动,而实际性能并未发生变化。
数据来源

服务水平数据通常来自
- ACD 系统 (呼叫路由平台)
- 劳动力管理工具
- 实时和历史仪表板
精确计算取决于正确的系统配置,尤其是时钟启动时。.
计算服务水平时的常见错误
即使是经验丰富的运营团队也会犯这些计算错误,从而扭曲绩效衡量:
1. 将服务水平与平均应答速度混淆ASA)
服务水平衡量的是达到阈值的百分比;ASA 计算的是所有呼叫的平均等待时间。这些指标说明了不同的问题。您的 ASA 可能是 18 秒(看起来不错),但如果您的一半呼叫在 5 秒内接听,而另一半呼叫则等待 35 秒以上,那么您的服务水平可能是 65%。服务水平可以防止平均值掩盖双峰分布,即一些客户获得了优质服务,而另一些客户则等待了令人无法接受的时间。.
2.排除过多的放弃呼叫
有些团队排除了所有放弃的电话,以 “关注我们实际处理的电话”。这大大夸大了结果。如果您在临界值内接听了 160 个电话,但有 40 个客户在等待后放弃了,那么排除这 40 个客户后,您的服务水平看起来是 160/160 = 100%,而不是准确的 160/200 = 80%。你掩盖了 20% 客户放弃的事实--这正是服务水平应该提供的洞察力。.
3.使用不一致的时间阈值
在报告期中期更改阈值会破坏趋势分析。如果一月份使用 20 秒,二月份使用 30 秒,而三月份又恢复到 20 秒,那么您的服务水平百分比就没有可比性。20 秒的 75% 服务水平比 30 秒的 85% 代表更快的应答。保持一致的阈值,以便进行有意义的性能跟踪。.
4.只报告日平均数
82% 的每日服务水平看起来可以接受,但它可能掩盖了上午 9 点 60% 和下午 2 点 95% 的服务水平。服务水平应以 15 或 30 分钟为间隔进行计算,以确定模式,而不是全天的平均值。间隔级数据可以揭示何时人手不足,何时需要调整调度。.
5.无需验证即可信任仪表盘显示
实时挂牌有时会显示 “服务水平目标实现情况”(绿色 = 好,红色 = 差),但不会显示实际百分比,也不会明确定义所衡量的内容。请务必核实您的仪表板在计算服务水平时是否与您的定义一致,特别是如何处理放弃呼叫和时间阈值。.
- 使用不一致的阈值
从 20 秒改为 30 秒会破坏趋势分析。. - 不懂逻辑就相信墙板
有些显示屏显示的是目标实现情况,而不是实际百分比。. - 只报告日或月平均值
应在短时间内跟踪服务水平。.
先理解逻辑。.
那就相信数字吧。.
服务水平与其他呼叫中心指标
 呼叫中心指标:ASA、放弃率、首次解决率(FCR)和平均处理时长(AHT)对比图” width="800" height="600" />
| 公制 | 衡量标准 | 何时使用 |
|---|---|---|
| 服务水平 | % 在规定时限内答复 | 速度和可达性 |
| ASA | 平均等待时间 | 总体延误趋势 |
| 放弃率 | 挂断电话的 % 呼叫者 | 客户耐心 |
| FCR | 首次通话即解决问题 | 服务质量 |
没有任何一项指标能说明问题的全部。.
快速总结:如何计算和解释服务水平
服务水平提供了一个清晰、可操作的衡量标准,用于衡量呼叫中心连接客户与座席的速度。平均值会掩盖性能的差异,而服务水平的二进制阈值则不同,它可以建立问责制:每个呼叫要么符合标准,要么不符合标准。.
主要收获:
标准公式--(阈值内接听的电话数÷提供的电话总数)×100--在各行业中保持一致。阈值的选择决定了对客户而言 “足够好 ”的含义。80/20 基准适用于许多业务,但高紧急排队可能需要 85/15 或 90/20 标准。.
计算中必须包括放弃的呼叫,以反映真实的客户体验。将其排除在外会掩盖服务故障并夸大结果。不过,大多数中心都会合理地排除 5 秒钟以下的放弃呼叫,因为它们很可能是误拨。.
服务水平最好与平均接听速度、放弃率和首次呼叫解决率等补充指标一起使用。这些指标结合在一起,可以全面了解可访问性(服务水平)和质量(FCR)。.
运行应用:
将服务水平数据用于劳动力规划--识别需要增加人手的高峰期,验证计划的有效性,并在班次中途绩效下降时做出实时调整决策。服务水平是一个领先指标,能够实现主动管理,而不是被动解决问题。.
准确计算服务水平首先要规范方法,确定阈值、放弃呼叫规则和测量间隔。当您的数据一致可靠时,您的运营决策也会相应得到改善。.
常见问题 (FAQ)

什么是呼叫中心的服务水平?
呼叫中心的服务水平衡量在预定时间内接听电话的百分比,例如在 20 秒内接听 80% 的电话。这是评估呼叫中心效率和客户满意度的关键绩效指标。.
如何计算呼叫中心的服务水平?
服务水平的计算公式如下
(在临界值内接听的电话数÷提供的电话总数)×100
例如,如果提供 100 个呼叫,其中 80 个在目标时限内接听,则服务级别为 80%。.
服务级别和 ASA 有什么区别?
服务水平衡量的是在特定时间内接听电话的百分比,而 ASA(平均接听速度)反映的是座席人员接听电话所需的平均时间。两者都很重要,但监测目的不同。.
在计算服务水平时,是否应将废弃呼叫排除在外?
这要视情况而定。有些呼叫中心会排除短时间内(如 5 秒)的放弃呼叫,因为它们可能代表意外拨号。但是,排除所有放弃呼叫可能会误导绩效。计算的一致性至关重要。.
什么是 80/20 服务水平标准?
80/20 标准是指在 20 秒内接听 80% 的电话,这是业内的一个通用基准。虽然该标准能有效衡量效率,但其适用性可能因客户期望和呼叫中心目标的不同而有所差异。.
为什么服务水平对呼叫中心运营非常重要?
服务水平直接影响客户满意度、等待时间和运营效率。保持最佳服务水平可确保快速为客户提供服务,最大限度地减少放弃呼叫的情况,并使人员配置与需求保持一致。.
应该多长时间衡量一次服务水平?
根据呼叫中心的需求,服务水平通常以每 30 分钟、每小时或每天等间隔来衡量。频繁的监控可以更好地优化劳动力并进行实时调整。.
更多信息
呼出呼叫中心类型 优势和设置指南
自动呼叫分配软件 提高效率指南
更多内容 运营与客户体验优化
查看全部 →
预测式拨号器 vs 自动拨号器:核心区别及选择指南
如果您需要更快的外呼速度,但不确定哪种拨号器最适合您的需求,本指南将快速为您提供明确的答案。我将用通俗易懂的语言,为您对比预测式拨号器(predictive dialer)与自动拨号器(auto dialer),内容涵盖二者的工作原理、各自最适用的场景、在呼叫量、个性化程度及TCPA合规性等方面的权衡取舍,并提供一个简单实用的决策框架,助您轻松做出选择……


2026 年最佳 Pipedrive 电话拨号工具:功能与适配性对比
如果 Pipedrive 能很好地管理您的销售线索流程,那么通常欠缺的环节便是更快速、更智能的电话外呼功能。本指南将帮助您对比适用于外呼销售、跟进工作流及团队日常使用的最佳 Pipedrive 电话拨号器工具。您将了解到:哪些选项适配不同的销售模式,哪些功能至关重要,需要规避哪些常见错误,以及如何在 Pipedrive 中配置拨号器,而不会让您的……

呼叫中心仪表板软件:功能、关键绩效指标(KPI)及最佳工具
呼叫中心团队会产生大量数据,但这并不意味着他们总能获得清晰的洞察。如果管理者无法实时查看队列激增、服务风险或座席绩效等情况,就只能被动响应、为时已晚。这会导致决策迟缓、辅导不一致,以及本可避免的客户不满。本指南以通俗易懂的语言介绍呼叫中心仪表板软件,涵盖……