
Contact center KPI benchmarking helps you measure performance against realistic industry standards, not assumptions. Used correctly, it guides staffing, service levels, and CX decisions without damaging customer experience.
Key Takeaways
Contact center KPI benchmarks provide context, not hard targets, for performance decisions. Core KPIs—Average Handling Time (AHT), Average Speed of Answer (ASA), First Call Resolution (FCR), Customer Satisfaction (CSAT), and Net Promoter Score (NPS)—vary widely by industry and interaction complexity. Industry-specific benchmarks prevent over-optimization that harms customer experience. Benchmarks work best as guardrails, defining acceptable performance ranges while you focus on internal trends and business goals. Misreading benchmarks leads to poor staffing decisions, agent burnout, and declining customer experience.
What Is Contact Center KPI Benchmarking?
Contact center KPI benchmarking is the practice of comparing your performance metrics—like Average Handling Time, First Call Resolution, and Customer Satisfaction—against external industry standards or peer groups.
Its purpose is context, not judgment. Benchmarks answer critical questions that internal data alone cannot:
- Is our 7-minute Average Handling Time acceptable for financial services, or are we inefficient?
- Should we be concerned that our First Call Resolution is 68%, or is that normal for technical support?
- Are we understaffed if our Average Speed of Answer is 45 seconds, or is that typical for our industry?
Without benchmarks, you’re making staffing and technology decisions in a vacuum. With them, you can confidently tell executives: “Our ASA is 30 seconds—slightly above the industry average of 25 seconds, but well within the acceptable range. Reducing it further would require 15% more agents with minimal customer satisfaction improvement.”
Key distinctions:
Metrics measure activity—like call duration, wait time, or number of calls handled. KPIs are the critical metrics tied to business outcomes like customer satisfaction, loyalty, revenue, or cost control. Benchmarks define the acceptable performance range for your industry and use case.
The danger: Treating benchmarks as absolute targets instead of decision-support context. When operations leaders chase “top quartile” numbers without understanding trade-offs, they often damage customer experience while increasing costs.
Why Contact Center KPI Benchmarks Matter for Performance Decisions
Benchmarks influence nearly every operational decision a contact center leader makes.
They shape how you staff teams, invest in technology, and define service expectations. Used well, they prevent extremes. Used poorly, they create them.
What benchmarks help you do
- Set realistic expectations for executives who want faster, cheaper service.
- Balance efficiency and experience by showing acceptable performance ranges.
- Identify outliers, not micromanage averages.
- Support budget decisions with external data, not internal opinions.
What benchmarks do not do
- They do not define success on their own.
- They do not replace internal trend analysis.
- They do not apply equally across channels, tiers, or customer segments.
Real-world scenario
A retail contact center noticed their Average Speed of Answer was 40 seconds—well above the industry benchmark of 20 seconds reported for “top performers.”
Leadership approved a major initiative to close the gap:
- Hired 25 additional agents (annual cost: $875,000)
- Implemented new call routing rules to minimize wait times
- Changed agent performance metrics to prioritize speed
Results after 6 months:
- ASA dropped to 18 seconds ✓
- Staffing costs increased 30% ✗
- CSAT dropped from 82% to 74% ✗
- First Call Resolution declined from 76% to 68% ✗
What went wrong?
Post-implementation analysis revealed that customers cared more about resolution quality than answer speed. The aggressive focus on ASA pressured agents to rush through calls, leading to incomplete resolutions and increased repeat contacts.
The benchmark (20 seconds for top performers) was real, but misapplied. Those “top performers” were handling simple retail queries (order status, returns) while this contact center handled more complex product support and technical troubleshooting. Their 40-second ASA was actually appropriate for their call mix.
Key lesson: Context matters more than the number.
Practical guidance
Use benchmarks as guardrails, not finish lines.
- If you are far outside the range, investigate.
- If you are inside the range, focus on consistency and trends.
- If improving one KPI hurts another, stop and reassess.
Core Contact Center KPIs Used for Benchmarking
These KPIs are most commonly used because they connect operational performance with customer outcomes.
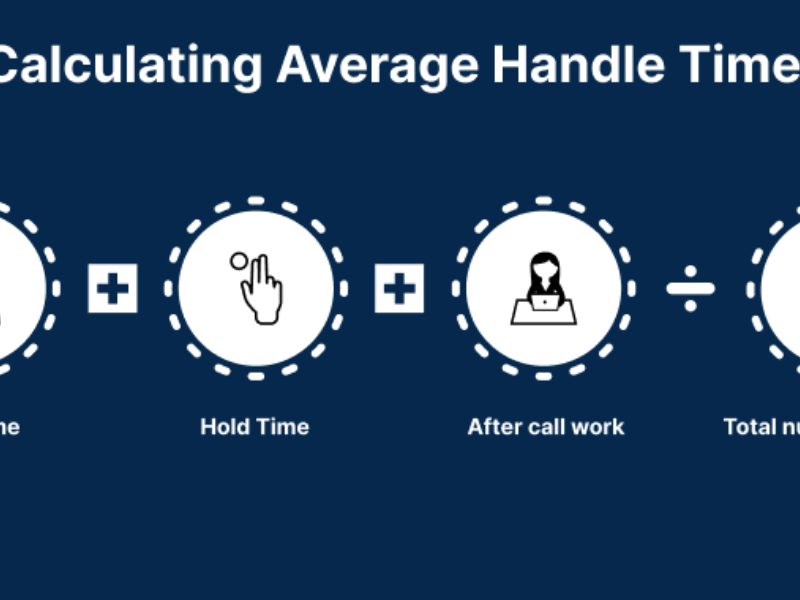
Average Handling Time (AHT)
- Average Handling Time measures the total time an agent spends on a customer interaction, from the moment the call connects until after-call work (notes, CRM updates, case logging) is complete.Typical benchmark: 5–7 minutes for voice interactions, though this varies significantly by call complexity:
- Quick transactional calls: 2-4 minutes (balance checks, password resets, order status)
- Standard support calls: 5-7 minutes (account inquiries, basic troubleshooting, billing questions)
- Complex resolution calls: 10-15 minutes (technical support, compliance verification, escalated issues)
Why AHT matters: Lower AHT means higher agent productivity—each agent handles more calls per hour, reducing cost per interaction. A team that reduces AHT from 7 minutes to 6 minutes increases daily call capacity by approximately 14% without adding staff.
The dangerous trap: Optimizing AHT in isolation often reduces resolution quality. When managers pressure agents to handle calls faster, agents may rush explanations, skip verification steps, or transfer calls prematurely—all of which damage First Call Resolution and increase repeat contacts.
Example of what goes wrong: A financial services contact center reduced AHT from 8 minutes to 6 minutes through aggressive coaching and strict time limits. Within 3 months:
- First Call Resolution dropped from 72% to 58%
- Repeat call volume increased 40%
- Customer Satisfaction declined from 78% to 65%
- Total cost per resolved issue INCREASED despite lower AHT
Why? Agents were rushing through security verification steps and account review processes, missing critical details that caused downstream errors and required follow-up calls.
Best practice: Track AHT alongside FCR and CSAT. If AHT improves but FCR or CSAT decline, stop immediately and investigate root causes.
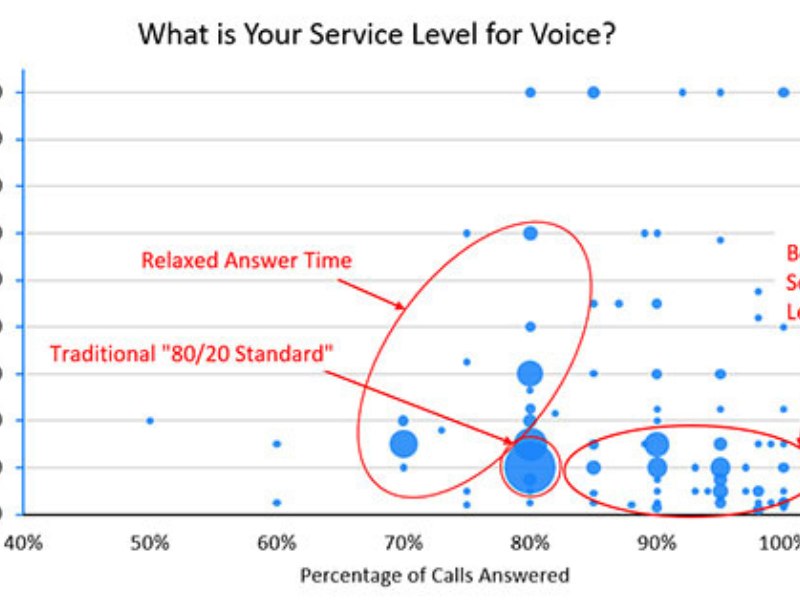
Average Speed of Answer (ASA)
- Average Speed of Answer measures how long customers wait in queue before speaking to an agent, from the moment they finish navigating IVR menus until a live agent answers.Common benchmark: 20–30 seconds for most industries, though acceptable ranges vary:
- Retail and e-commerce: 15-25 seconds (customers have low tolerance for waits)
- Banking and financial services: 30-45 seconds (customers expect some wait for secure interactions)
- Technical support: 25-40 seconds (customers understand complexity requires staffing depth)
- Emergency or urgent services: <15 seconds (critical for healthcare, utilities, crisis support)
Why ASA matters: ASA is strongly linked to call abandonment and customer frustration. Research shows abandonment rates increase exponentially after 40 seconds:
- At 20 seconds: 3-5% abandonment rate
- At 40 seconds: 8-12% abandonment rate
- At 60 seconds: 15-25% abandonment rate
For high-value calls (sales inquiries, VIP customers, urgent issues), every 10-second increase in ASA can cost thousands in lost revenue or customer satisfaction damage.
The complexity of ASA optimization: Unlike AHT, which can be improved through agent training and process efficiency, ASA is primarily a staffing and forecasting challenge. Improving ASA requires:
- Accurate volume forecasting to match agent schedules with call patterns
- Sufficient staffing levels during peak hours and seasonal surges
- Effective workforce management to minimize unplanned absences
- Backup capacity for unexpected volume spikes
Warning: Over-staffing to achieve “best-in-class” ASA creates cost inefficiency. The goal is reaching the acceptable range for your industry and call type, not matching the absolute fastest ASA.
Best practice: Monitor ASA in real-time and set threshold alerts (e.g., “notify supervisors if ASA exceeds 40 seconds for more than 10 minutes”) to enable tactical responses like shifting agents from back-office work to call handling.
First Call Resolution (FCR)
- First Call Resolution measures the percentage of customer issues resolved completely during the first interaction, with no need for follow-up calls, escalations, or additional contacts.Typical range: 65–80%, depending on issue complexity and industry:
- Transactional inquiries (order status, balance checks): 80-90%
- Standard support (password resets, billing questions): 70-80%
- Technical troubleshooting: 60-75%
- Complex or multi-department issues: 50-65%
Why FCR matters: FCR is one of the strongest predictors of customer satisfaction and operational efficiency:
- Customers strongly prefer one-and-done resolutions—having to call back multiple times is the #1 driver of dissatisfaction
- Higher FCR reduces repeat call volume, lowering overall contact center costs
- Each repeat contact adds incremental cost (agent time, system resources) and compounds customer frustration
Example impact: A contact center handling 100,000 calls monthly with 70% FCR has 30,000 unresolved cases. If FCR improves to 75%, that drops to 25,000 unresolved cases—5,000 fewer repeat calls per month. At an average cost of $5 per call, that’s $25,000 monthly savings ($300,000 annually).
The challenge with measuring FCR: Accurate FCR measurement requires clear definitions:
- What counts as “resolved”? (Customer perception vs agent assessment)
- What time window defines “first call”? (Same day? Within 7 days? Different issue types may need different windows)
- How do you handle transfers? (Does a transfer within the same call count as FCR, or must a single agent handle it end-to-end?)
Without consistent methodology, FCR data becomes unreliable for benchmarking.
Common FCR killers:
- Agents lacking access to information or tools needed to resolve issues
- Complex issues requiring specialized knowledge not available in first-tier support
- Poor knowledge management systems that slow down information retrieval
- Inadequate agent training on common issue types
- Escalation protocols that are too restrictive or too permissive
Best practice: Track FCR reasons for failure. If 40% of your repeat calls are due to “agent needed information from billing system but couldn’t access it,” you’ve identified a clear improvement opportunity that no amount of agent coaching will fix.
Call Abandonment Rate
- Measures how many callers hang up before reaching an agent.
- Acceptable range: 3–7%.
- Often caused by understaffing or poor forecasting.
Customer Satisfaction Score (CSAT)
- Collected via post-interaction surveys.
- Typical benchmark: 75–85%.
- Best used as a trend, not a single score.
Net Promoter Score (NPS)
- Measures loyalty and likelihood to recommend.
- Highly variable by industry.
- More relevant for financial services and subscription-based models.
Contact Center KPI Benchmarks by Industry
Industry context determines what “good” actually looks like
.
Retail Contact Centers
Retail contact centers handle high volume, low complexity interactions with strong seasonality.
| KPI | Typical Benchmark Range |
|---|---|
| ASA | 20–30 seconds |
| AHT | 4–6 minutes |
| FCR | 70–80% |
| Abandonment | 3–6% |
| CSAT | 78–85% |
Retail performance depends on speed and availability, especially during promotions and holidays.
Use case:
During peak season, slightly higher AHT is acceptable if FCR remains stable and CSAT does not drop.
Banking and Financial Services (BFSI)
BFSI contact centers operate under strict compliance and trust expectations.
| KPI | Typical Benchmark Range |
|---|---|
| ASA | 30–45 seconds |
| AHT | 6–8 minutes |
| FCR | 65–75% |
| CSAT | 75–82% |
| NPS | +20 to +40 |
Security checks and regulatory disclosures increase handling time.
NPS matters more here because trust directly impacts retention.
Healthcare Contact Centers
Healthcare interactions are urgent and emotionally charged.
| KPI | Typical Benchmark Range |
|---|---|
| ASA | 20–40 seconds |
| AHT | 6–7 minutes |
| Abandonment | 5–8% |
| FCR | 70%+ |
| CSAT | 75–80% |
Long holds increase abandonment risk dramatically.
Even small ASA improvements can reduce missed appointments and complaints.
Technology and SaaS Support Centers
Support complexity varies by tier and product maturity.
| KPI | Typical Benchmark Range |
|---|---|
| ASA | 25–35 seconds |
| AHT | 7–10 minutes |
| FCR | 60–75% |
| CSAT | 80%+ |
Higher AHT is normal for technical troubleshooting.
Resolution quality matters more than speed, especially for enterprise customers.
[Ảnh: Tiered support funnel]
Education and EdTech Contact Centers
- Strong seasonality around enrollment and exams.
- ASA and abandonment spike during peak periods.
- Benchmarks should be reviewed by time of year, not annually.
Nonprofit and Public Sector Contact Centers
- Cost per contact is often a primary KPI.
- Benchmarks vary widely based on funding and mandate.
- Efficiency must be balanced with accessibility.
How to Interpret KPI Benchmarks Without Misreading Them
Benchmarks are ranges, not goals.
Misinterpretation is the most common reason benchmarking fails.
- Treat ranges as acceptable zones, not targets.
Being at the low end is not always better. - Account for channel mix.
Voice, chat, and email benchmarks are not interchangeable. - Compare trends, not snapshots.
Consistent improvement matters more than beating a number once. - Accept intentional underperformance.
Longer AHT may be correct for complex or high-value interactions. - Segment before judging.
Tier 2 support should not be compared to Tier 1 benchmarks.
Common Mistakes in Contact Center KPI Benchmarking

- Optimizing one KPI in isolation, causing downstream damage.
- Using generic benchmarks that ignore industry and complexity.
- Chasing top-quartile numbers without matching resources.
- Ignoring seasonality and demand spikes.
- Failing to align benchmarks with business goals.
Avoid these by reviewing KPIs together and validating decisions with frontline feedback.
How Often Contact Center KPI Benchmarks Should Be Reviewed
- Quarterly for operational tuning.
- Annually for strategic planning.
- Immediately after major changes like new channels, AI adoption, or volume shifts.
Data Sources and Tools for Contact Center KPI Benchmarking

- Industry benchmark reports and peer studies.
- Contact center analytics platforms with historical comparisons.
- Performance dashboards with segmentation and trend views.
FAQ

What is a good contact center KPI benchmark?
A good benchmark is one that reflects your industry, channel mix, and interaction complexity, not a universal number.
Should benchmarks be used as targets?
No. Benchmarks define acceptable ranges and context, not mandatory goals.
Why do KPI benchmarks vary so much by industry?
Customer expectations, compliance requirements, and issue complexity differ significantly across industries.
Can small contact centers use industry benchmarks?
Yes, but they should focus on trends and ranges rather than exact alignment.
Closing Guidance

Contact center KPI benchmarking works when it informs decisions, not when it dictates them.
Compare your performance to industry ranges. Interpret the data in context. Improve deliberately.
Use benchmarks as decision support, not absolute truth.
Frequently Asked Questions

What is contact center KPI benchmarking?
Contact center KPI benchmarking is the process of comparing your metrics, like Average Handling Time or Customer Satisfaction Score, to industry benchmarks. It helps identify gaps in performance and refine strategies for better efficiency and customer experience.
Why is it important to benchmark KPIs by industry?
Industry-specific benchmarks provide context for performance evaluation. For example, healthcare contact centers prioritize metrics like Speed to Answer, while retail focuses on First Call Resolution. Comparing KPIs to relevant standards ensures targeted improvements.
What are common benchmarks for Average Handling Time?
Average Handling Time (AHT) benchmarks vary by industry but generally range between 5-6 minutes. Retail often targets ~5 minutes, while healthcare contact centers may exceed 6 minutes due to complexity.
How often should KPI benchmarks be reviewed?
Ideally, review benchmarks quarterly or after significant operational changes. Continuous monitoring helps adapt to trends, identify new pain points, and optimize resources effectively.
What are some tools for contact center KPI tracking?
Tools like Sprinklr Service, CloudTalk, and Giva software offer features such as AI-driven insights, real-time dashboards, and analytics for precise KPI tracking and benchmarking across industries.
What are common mistakes in KPI benchmarking?
Mistakes include treating benchmarks as fixed targets, neglecting channel-specific dynamics, and focusing on a single KPI. Avoid these by interpreting benchmarks as guidelines, not absolutes, and consider holistic trends.
Can benchmarking improve both inbound and outbound call center performance?
Yes, benchmarking enhances performance across inbound and outbound operations by identifying inefficiencies, such as long response times, and aligning processes with industry standards for seamless service delivery.
What are the benchmarks for First Call Resolution?
First Call Resolution (FCR) typically ranges from 68% to 78%, depending on industry. High-performance industries like retail aim for ~78%, while complex sectors like healthcare may target lower rates due to intricate queries.
Read more:
AI Contact Center Solutions Transform Customer Support at Scale
AI Speech Analytics for Customer Experience in Contact Centers